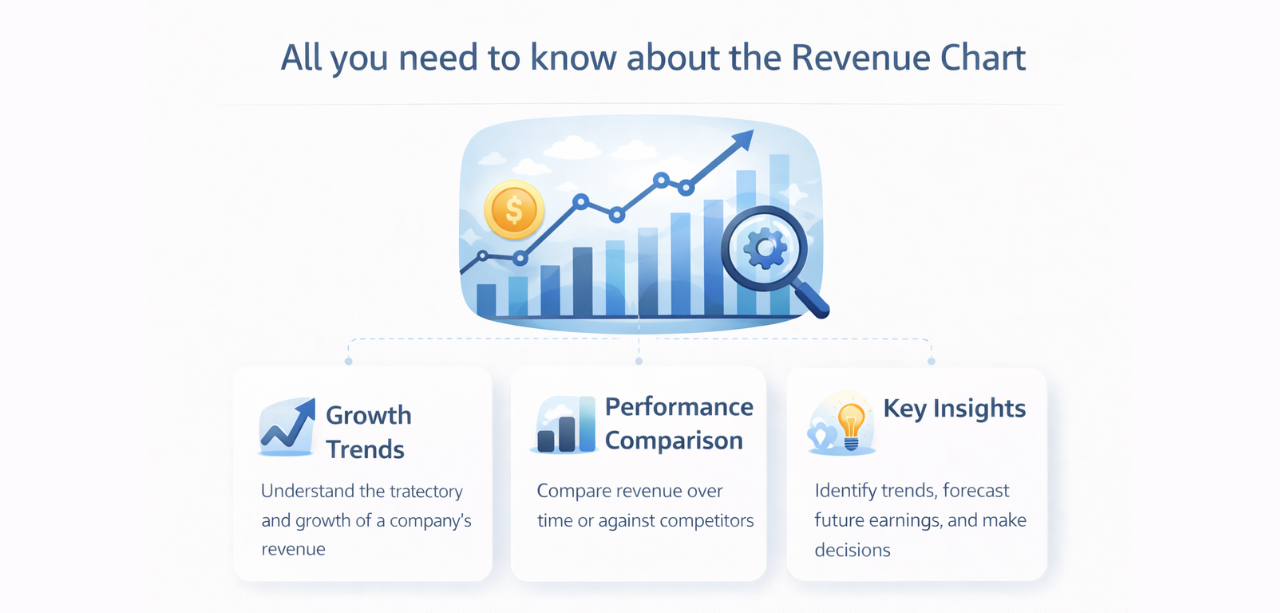
All you need to know about the revenue chart
Introduction
Every business wants to grow. But wanting growth and actually measuring it are two very different things. That’s where a revenue growth chart comes in.
Whether you’re a startup founder trying to hit your first $1M in revenue or a finance analyst presenting quarterly results to a board, a revenue growth chart gives you a clear, visual story of how your business is performing over time. It cuts through the noise of raw numbers and shows you — at a glance — whether you’re moving in the right direction.
In this guide, we’ll break down everything you need to know about revenue charts: what they are, why businesses rely on them, how to build one, and how to read them correctly.
What Is a Revenue Growth Chart?
A revenue growth chart is a visual representation that tracks how a company’s revenue changes over a specific period of time. It typically plots revenue data (monthly, quarterly, or annually) on an axis to reveal upward or downward trends in business performance.
In simple terms: it’s a picture of how much money your business is making — and whether that number is going up or down.
Revenue growth charts are widely used in pitch decks, investor reports, financial dashboards, and internal business reviews. They’re one of the first things investors and executives look at when evaluating business health.
Why Businesses Use a Revenue Chart
A revenue chart isn’t just a pretty graph — it’s a decision-making tool. Here’s why companies use them:
- Track performance over time: Instead of comparing isolated monthly figures, a revenue chart shows the full trajectory of your business growth.
- Identify growth trends: Patterns like consistent month-over-month increases or seasonal dips become immediately visible.
- Make strategic decisions: If your chart shows a plateau in Q3 every year, you can proactively launch campaigns or adjust pricing before the slowdown hits.
- Communicate with stakeholders: Investors, board members, and leadership teams understand charts faster than spreadsheets. A clean revenue chart tells your story instantly.
- Set realistic forecasts: Historical revenue data helps you project future performance with greater accuracy.
For startups especially, a well-maintained revenue chart can be the difference between securing funding and getting passed over.
Types of Revenue Growth Charts
Not all revenue charts are created equal. Depending on what you’re analyzing, different chart types serve different purposes.
Line Charts
The most common format. Line charts are ideal for showing continuous revenue growth over time — month by month or year by year. They make it easy to spot upward trends, plateaus, and sharp drops.
Bar Charts
Great for comparing revenue across different periods side by side. A bar chart showing Q1 through Q4 makes seasonal differences immediately obvious.
Monthly Revenue Charts
These zoom into a single year and track revenue on a month-by-month basis. They’re perfect for operational teams managing short-term performance.
Year-Over-Year (YoY) Growth Charts
These compare the same time period across multiple years — for example, Q2 2023 vs. Q2 2024. YoY charts help filter out seasonal noise and show true business growth.
Cumulative Revenue Charts
These show total revenue added over time. They’re often used in investor updates to show overall business momentum rather than month-to-month fluctuations.
How to Create a Revenue Growth Chart
Building a revenue chart doesn’t have to be complicated. Here’s a simple step-by-step process:
- Collect your revenue data. Pull historical revenue figures from your accounting software, CRM, or financial records. Make sure your numbers are consistent — use the same revenue definition (gross, net, MRR, ARR, etc.) throughout.
- Organize data by time period. Arrange your data in a spreadsheet with dates in one column and revenue figures in another. Monthly intervals work well for most businesses.
- Choose a visualization tool. Open Excel, Google Sheets, or a BI tool like Tableau or Looker. Select your data range and insert a chart.
- Pick the right chart type. For growth trends, a line chart is usually best. For period comparisons, go with a bar chart.
- Add context. Label your axes clearly, add a title, and annotate key events (like a product launch or a major campaign) that explain spikes or dips.
- Analyze the trend. Look at the overall direction. Is revenue growing consistently? Are there unexpected drops? Use what you see to inform your next move.
Tools Used to Build Revenue Charts
You don’t need expensive software to build a solid revenue chart. Here are the most commonly used tools:
- Microsoft Excel: Still the go-to for most finance teams. Excel’s charting features are powerful and flexible.
- Google Sheets: Free, cloud-based, and great for collaboration. Ideal for startups and small teams.
- Tableau / Looker / Power BI: Enterprise-grade BI tools that pull data from multiple sources and generate interactive dashboards in real time.
- HubSpot / Salesforce: CRMs with built-in revenue reporting dashboards. Great if your revenue data lives in your sales pipeline.
- Stripe / QuickBooks / Xero: Accounting and payment platforms that generate revenue charts automatically from transaction data.
For early-stage companies, Google Sheets works perfectly fine. As you scale, investing in a BI tool pays off quickly.
How Businesses Interpret Revenue Growth Charts
Reading a revenue chart is more than just checking if the line goes up. Here’s what different patterns typically mean:
- Steady upward slope: Healthy, consistent growth. This is what investors love to see.
- Steep vertical jump: Often tied to a specific event — a viral launch, a major partnership, or a marketing campaign. Dig into what caused it and try to replicate it.
- Seasonal waves: Predictable dips and peaks tied to the time of year. Common in retail, e-commerce, and tourism. Plan your cash flow accordingly.
- Flat line: Revenue has plateaued. Time to revisit your growth strategy, pricing, or product offering.
- Declining curve: A red flag. Investigate immediately — is it customer churn, market shifts, or a product issue?
Context matters as much as the chart itself. Always pair your revenue chart with other metrics like customer acquisition cost, churn rate, and gross margin.
Common Mistakes When Reading Revenue Charts
Even experienced analysts can misread a revenue chart. Watch out for these pitfalls:
- Ignoring the time scale: A chart that starts mid-year or uses inconsistent intervals can make growth look faster or slower than it actually is.
- Confusing gross and net revenue: Make sure you know what type of revenue is being measured. Gross revenue can look great while net revenue tells a very different story.
- Celebrating short-term spikes: A one-month revenue spike is exciting, but it doesn’t confirm a growth trend. Look at at least 3–6 months before drawing conclusions.
- Not accounting for seasonality: Comparing December to January without adjusting for seasonal patterns can lead to false alarms.
- Looking at revenue in isolation: Revenue growth means little without knowing your costs, margins, and retention rates. Always look at the full picture.
READ ALSO:- What Is an Insertion Order?
Conclusion
A revenue growth chart is one of the most powerful tools in any business owner’s or analyst’s toolkit. It transforms raw numbers into a clear, actionable story about where your business has been — and where it’s heading.
Whether you’re building your first revenue chart in Google Sheets or managing a sophisticated BI dashboard, the goal is the same: understand your growth trajectory well enough to make confident, informed decisions.
Start tracking your revenue data consistently, choose the right chart format for your needs, and make it a habit to review your revenue chart every month. The patterns it reveals will tell you more about your business than almost any other metric.
Frequently Asked Questions (FAQ)
Q1. What is a revenue growth chart?
Ans: A revenue growth chart is a visual tool that tracks how a company’s revenue changes over time. It helps businesses identify growth trends, spot performance issues, and make data-driven decisions.
Q2. How is revenue growth calculated?
Ans: Revenue growth is calculated using the formula: ((Current Period Revenue − Prior Period Revenue) / Prior Period Revenue) × 100. This gives you a percentage that shows how much revenue has increased or decreased.
Q3. What is a good revenue growth rate for a startup?
Ans: For early-stage startups, a monthly growth rate of 5–10% is generally considered strong. For SaaS companies, the “Triple, Triple, Double, Double, Double” (T2D3) framework is a common benchmark for exceptional growth.
Q4. What’s the difference between a revenue chart and a profit chart?
Ans: A revenue chart shows total income before expenses. A profit chart shows what’s left after costs are deducted. Both are important — revenue shows momentum, while profit shows sustainability.
Q5. Which tool is best for creating a revenue growth chart?
Ans: For most small businesses and startups, Google Sheets or Excel are more than sufficient. As your data grows in complexity, tools like Tableau, Looker, or Power BI offer more advanced visualization and real-time data integration.
Related Articles
Continue your learning journey with these related insights
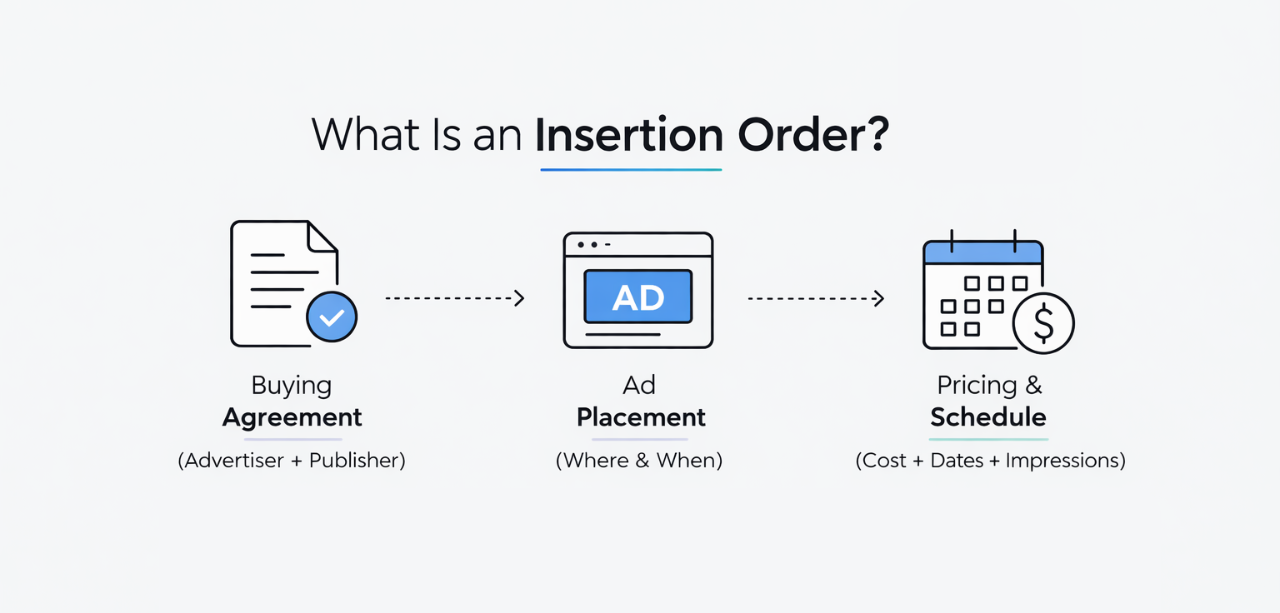
What Is an Insertion Order? A Complete Guide for Modern Advertising and Marketing Teams
In the fast-paced world of digital marketing, where millions of ads are bought and sold in milliseconds via algorithms, it’s easy to think that “handshake deals” have gone entirely digital. But when you’re moving significant budgets—whether it’s a $5,000 localized campaign or a $500,000 national takeover—you need more than just a “settings saved” notification. You […]
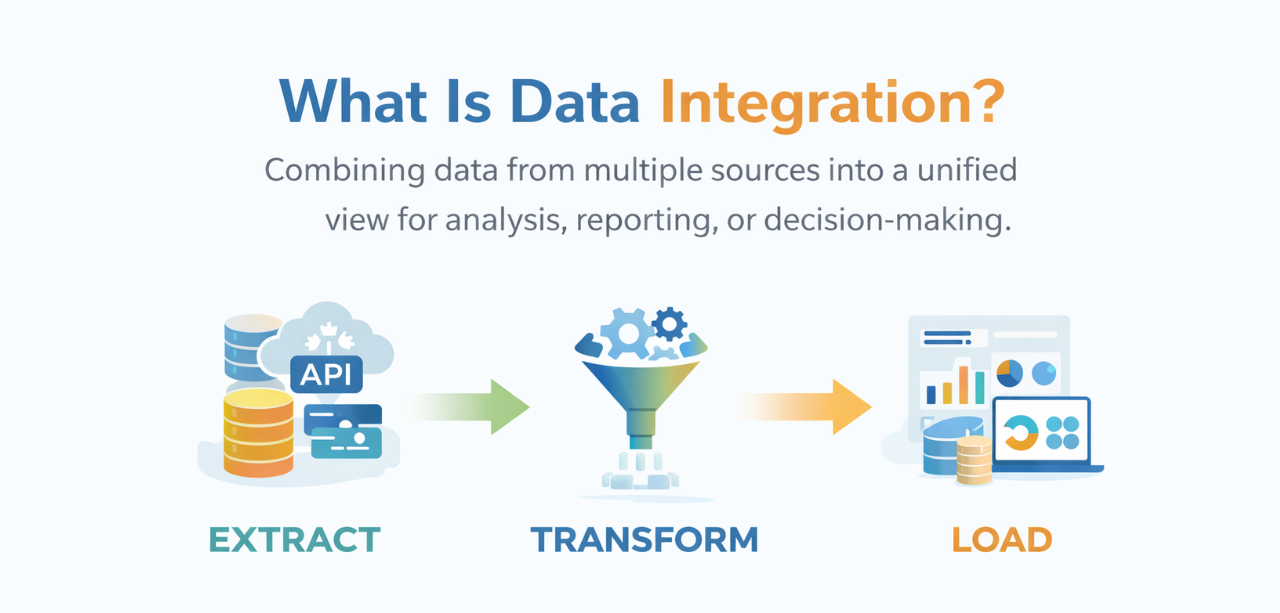
What Is Data Integration? A Complete Guide for 2026
Introduction Your sales team uses Salesforce. Your marketing team relies on HubSpot. Your finance department lives in QuickBooks. And your customer data? It’s scattered across all three—plus a dozen other systems. Sound familiar? This is the reality for most modern businesses. Data silos aren’t just inconvenient—they cost companies millions in lost insights, duplicated efforts, and […]

What’s the Difference Between AdTech and MarTech?
In today’s digital-first world, marketing success depends heavily on technology. Two terms you’ll hear constantly are MarTech and AdTech. While they often work together, they serve very different purposes. Understanding the differences between martech and adtech is essential for building effective marketing strategies, enhancing customer experience, and maximizing return on investment (ROI). This guide explains […]
Ready to Transform Your Advertising Strategy?
Join thousands of advertisers who trust Performoo to optimize their campaigns and maximize revenue.